In this lunchtime #WPQuickies, I’ll take you on a tour of the WordPress Site Health tool.
The Site Health tool was introduced in WordPress 5.2. It monitors the overall health of your website and notifies you of any major issues.
You need to check this tool regularly to get on top of any WordPress core issues. Plugin authors are also starting to use the Site Health tool to notify users of plugin issues.
Where Did The Site Health Tool Come From?
As is common for a lot of core features, the Site Health tool started as a feature plugin.
Although the tool has been integrated into the WordPress core, the feature plugin still exists in the WordPress.org repository at https://wordpress.org/plugins/health-check/ where you can report any issues.
Where To Find Site Health
You can find the Site Health tool by navigating to Tools > Site Health in your admin dashboard.
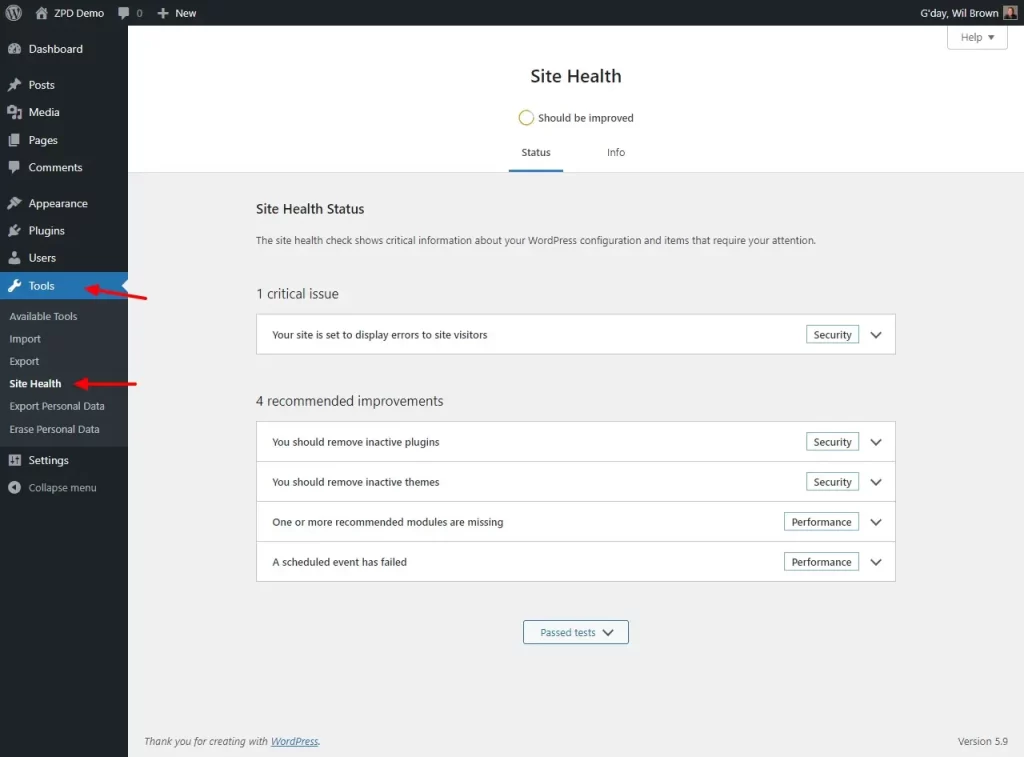
It consists of two parts; a Status screen and an Info screen.
Site Health Dashboard Widget
WordPress 5.4 introduced the Site Health widget to the home dashboard so it’s super easy to keep an eye on it for any highlighted issues.
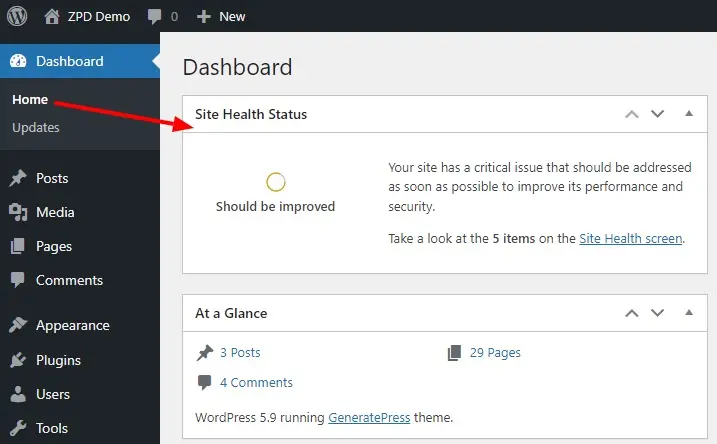
You can then navigate to the tool for more in-depth information.
What’s Available In The Site Health Area?
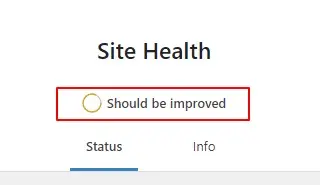
The Site Health tool gives you an overall summary of your site’s health directly under the page title. Mostly this will say “Should be improved”.
Site Health – Status Area
By default, the “Status” tab is selected and when you land on the page, WordPress performs background health tests, then updates any information on the screen after a second or more.
The “Status” screen shows issues at the top and recommended improvements underneath.
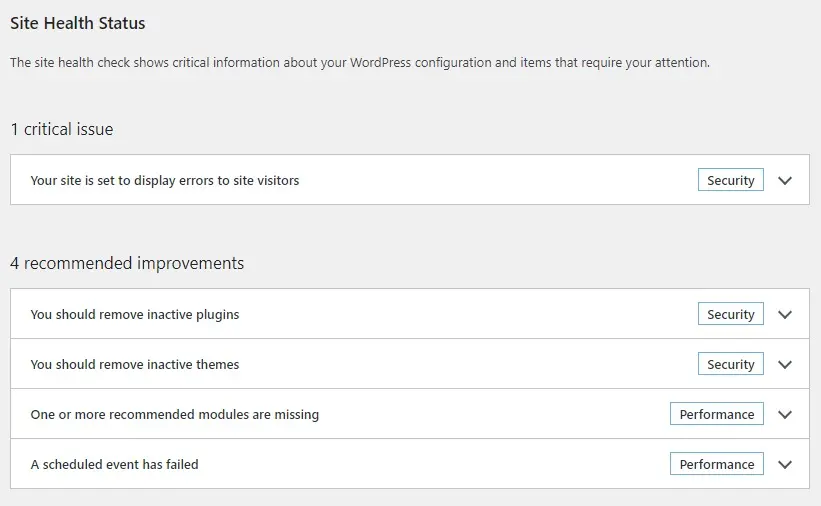
Each issue and recommended improvements are bundled into two major categories; Security and Performance
Performance: WordPress & PHP version, SQL server, required and recommended PHP modules are installed, UTF8MB4 support, scheduled events, HTTP requests, REST API, and loopback requests.
Security: Active themes and plugins, HTTPS connection, secure communication, debug mode off, communication with WordPress.org, and background updates status.
The Site Health tool gives you site health status in three different layers.
Critical Issues: This shows the number of critical issues found. Marks issues with categories namely security or performance and provides additional supporting information and resource links.
Recommended improvements: Shows all the recommendations to improve site health and gives instructions on how to address them individually.
Passed Tests: Displays the number of items with no issues and shows all items in detail.
At the bottom of the Status screen, you can see all the tests that have been completed and passed.
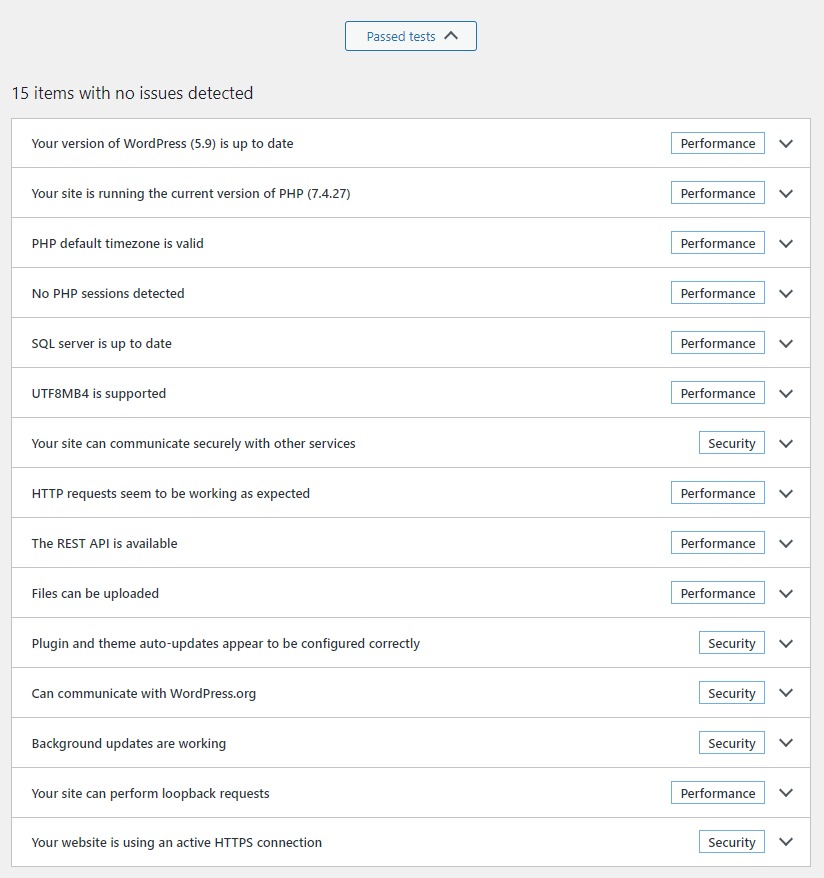
Site Health – Status Area – Issues
By default, all issues and recommendations are collapsed into accordions.
Expand each accordion to get more details on the issue or recommendation.
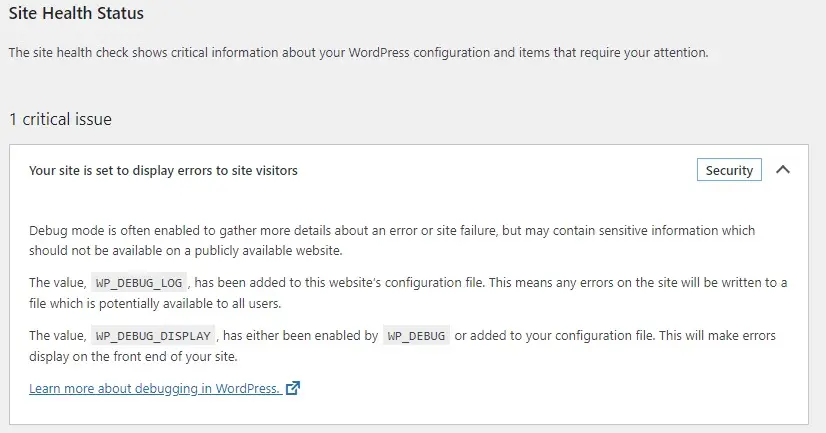
Here you can see the expanded issue is a warning about the WordPress Debug log being switched on. For security and performance, it is recommended that debugging is turned off on production servers.
The expanded information is likely to contain links to documentation, additional resources, or other dashboard areas.
Site Health – Info Area
The “Info” screen shows valuable information on your website setup including, WordPress, Directories and Sizes, Active Theme, Inactive Themes, Must Use Plugins, Active Plugins, Inactive Plugins, Media Handling, Server, Database, WordPress Constants and Filesystem Permissions.
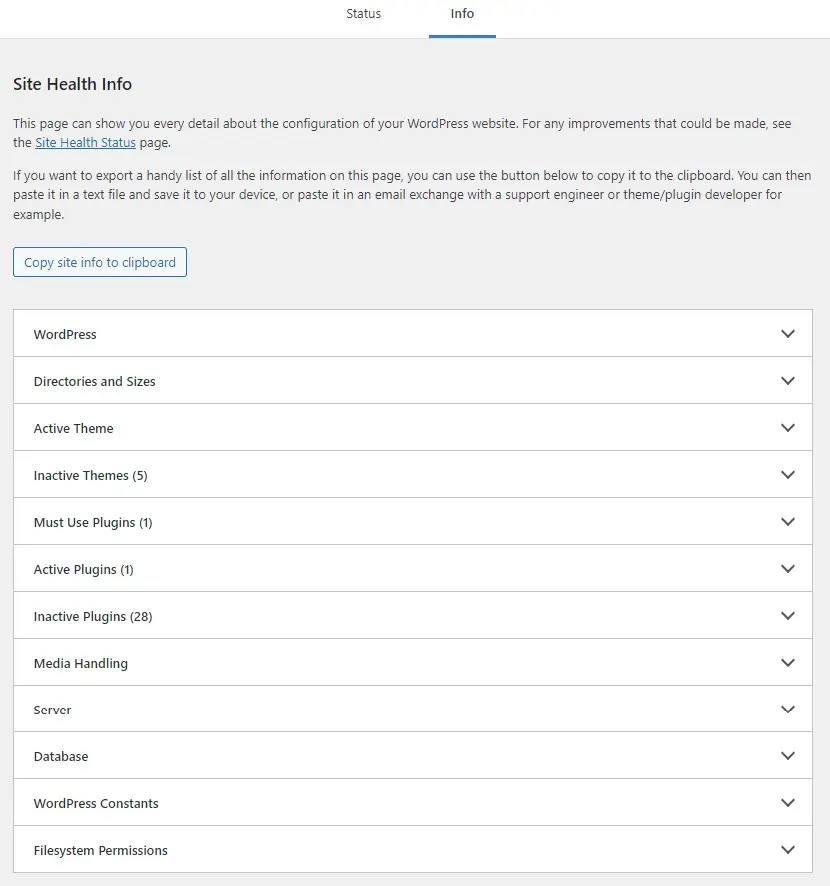
This screen gives a fantastic overview of the information you probably need to know if you’re thinking about moving, upgrading, tweaking performance or diagnosing problems with your website.
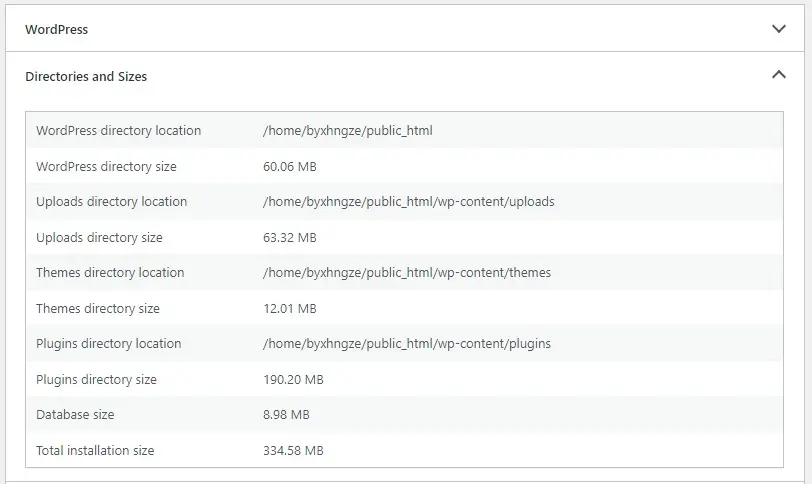
Databases and Sizes Info Panel
For example, the Databases and Sizes accordion shows information about directory locations, uploads directory size, database size and total installation size.
Very handy information if you’re planning to jump to a new web host.
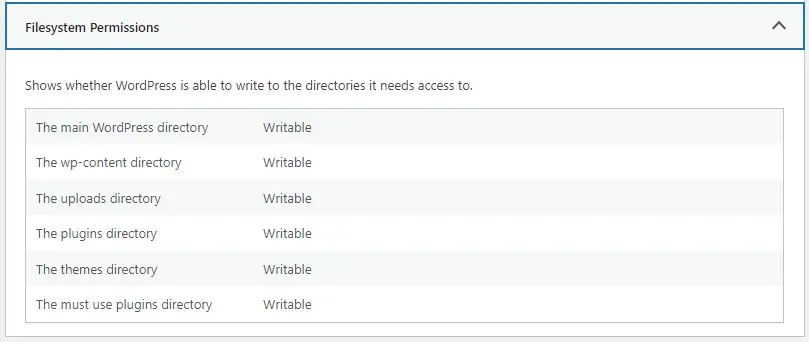
Filesystem Permissions Info Panel
A common issue WordPress users come across is errors when uploading media or updating themes and plugins.
The Filesystem Permissions accordion will let you know which directories are writable or read-only.
Demo – Quick Walkthrough Of Other Info Panels
See video.
Summary
The Site Health tool is a quick one-stop-shop for information about your website’s operational capability as well as server and other resource information about your website stack.
Do you still have questions about the WordPress Site Health tool?
Ask in the comments below.
#WPQuickies
Join me every Thursday at 1 pm Sydney time for some more WPQuickies – WordPress tips and tricks in thirty minutes or less.
Broadcasting live on YouTube and Facebook.
Suggest a #WPQuickies Topic
If you have a WordPress topic you’d like to see explained in 30 mins or under, fill out the form below.
https://forms.gle/mMWCNd3L2cyDFBA57
Watch Previous WPQuickies
-

How To Reduce TTFB and Improve Page Load Speed
-

Get Data From Multiple Tables Using SQL
-

How To Move WordPress To Another Web Host – WPQuickies
-

Who Owns WordPress? – WPQuickies
-

Will Page Builders Replace Web Designers & Developers? – WPQuickies
-

WordPress Updates: How Do They Work? – WPQuickies
-

Remove WordPress Header and Footer Using CSS – WPQuickies
-
WordPress Slugs What Are They & How To Change Them – WPQuickies
One Response
Excellent goods from you, man. I have understand your stuff previous to and you’re
just too great. I actually like what you have acquired here,
certainly like what you’re stating and the way in which you say it.
You make it entertaining and you still care for to keep it wise.
I can’t wait to read far more from you. This is actually a
terrific web site.